
Copyright (C)  FastTrack.
Permission is granted to copy, distribute and/or modify this document.This program is distributed in the hope that it will be useful, but WITHOUT ANY WARRANTY; without even the implied warranty of MERCHANTABILITY or FITNESS FOR A PARTICULAR PURPOSE.
Data analysis using Julia
Introduction
The Julia documentation and installation guide can be found at https://julialang.org/. We provide here a simple example that details how to import the tracking.txt file from FastTrack, and how to extract basic information like the number of objects, the number of images etc...
using DataFrames
using CSV
using PyPlot
using Plots
using StatsPlots
Importation
We are going to import the tracking file in a DataFrames. Note that the user needs to provide the full path to the tracking.txt file.
data = CSV.read("tracking.txt", delim='\t', DataFrame)
display(data)
| xHead | yHead | tHead | xTail | yTail | tTail | xBody | yBody | tBody | |
|---|---|---|---|---|---|---|---|---|---|
| Float64 | Float64 | Float64 | Float64 | Float64 | Float64 | Float64 | Float64 | Float64 | |
| 1 | 514.327 | 333.12 | 5.81619 | 499.96 | 327.727 | 6.10226 | 508.345 | 330.876 | 5.94395 |
| 2 | 463.603 | 327.051 | 0.301279 | 449.585 | 330.323 | 0.245547 | 458.058 | 328.346 | 0.238877 |
| 3 | 23.9978 | 287.715 | 3.70646 | 34.9722 | 278.836 | 3.99819 | 29.2056 | 283.505 | 3.84844 |
| 4 | 372.536 | 230.143 | 0.194641 | 354.226 | 231.604 | 6.08737 | 364.822 | 230.759 | 0.0515087 |
| 5 | 480.58 | 213.482 | 1.28236 | 478.125 | 228.52 | 1.53303 | 479.428 | 220.543 | 1.42567 |
| 6 | 171.682 | 143.55 | 6.09077 | 155.507 | 140.116 | 6.1146 | 164.913 | 142.113 | 6.08216 |
| 7 | 498.151 | 121.32 | 6.00177 | 483.712 | 119.285 | 0.0223247 | 492.683 | 120.55 | 6.15298 |
| 8 | 329.56 | 123.418 | 6.08726 | 312.526 | 119.042 | 5.9098 | 322.531 | 121.614 | 6.01722 |
| 9 | 465.256 | 115.045 | 4.44359 | 470.057 | 99.911 | 4.40559 | 467.106 | 109.205 | 4.40862 |
| 10 | 423.663 | 66.3789 | 0.0888056 | 409.105 | 67.2971 | 6.12053 | 417.615 | 66.7623 | 0.0292602 |
| 11 | 424.487 | 40.4232 | 5.48198 | 411.594 | 30.3912 | 5.88869 | 418.96 | 36.1192 | 5.64923 |
| 12 | 370.591 | 35.2147 | 5.99688 | 354.672 | 29.5633 | 5.89121 | 364.007 | 32.8767 | 5.94008 |
| 13 | 498.502 | 20.2527 | 5.66339 | 487.254 | 9.19499 | 5.39497 | 493.758 | 15.5781 | 5.5026 |
| 14 | 367.791 | 5.03034 | 6.05933 | 352.076 | 6.75603 | 0.653641 | 361.12 | 5.75904 | 0.152688 |
| 15 | 512.965 | 332.575 | 5.86617 | 499.435 | 327.759 | 6.052 | 507.626 | 330.673 | 5.95102 |
| 16 | 463.385 | 324.659 | 0.707 | 451.431 | 332.193 | 0.246265 | 458.959 | 327.443 | 0.542368 |
| 17 | 19.4579 | 293.022 | 4.28861 | 25.5579 | 281.206 | 4.18379 | 21.8962 | 288.302 | 4.23379 |
| 18 | 379.037 | 230.527 | 6.10571 | 361.728 | 229.616 | 0.199343 | 371.74 | 230.144 | 6.25939 |
| 19 | 478.884 | 206.712 | 1.27832 | 475.454 | 221.757 | 1.40929 | 477.197 | 214.108 | 1.35472 |
| 20 | 173.923 | 143.042 | 0.00732468 | 157.261 | 142.182 | 6.00453 | 167.066 | 142.689 | 6.20403 |
| 21 | 498.561 | 122.687 | 5.83253 | 486.357 | 118.196 | 6.13893 | 493.718 | 120.906 | 5.95151 |
| 22 | 328.812 | 124.134 | 6.05932 | 312.848 | 119.605 | 5.98617 | 322.331 | 122.294 | 6.00901 |
| 23 | 461.738 | 116.731 | 4.47649 | 466.371 | 101.736 | 4.40285 | 463.615 | 110.656 | 4.41641 |
| 24 | 428.631 | 69.2715 | 5.87139 | 415.665 | 64.6444 | 6.13862 | 423.218 | 67.3364 | 5.96558 |
| 25 | 425.821 | 44.9942 | 5.59983 | 414.84 | 33.2028 | 5.37159 | 421.248 | 40.0897 | 5.461 |
| 26 | 368.362 | 35.6219 | 5.97427 | 353.22 | 30.4625 | 5.88261 | 362.109 | 33.4891 | 5.94605 |
| 27 | 503.484 | 22.7293 | 5.76026 | 489.632 | 16.6315 | 5.92136 | 497.924 | 20.2857 | 5.86668 |
| 28 | 369.184 | 5.84074 | 6.15994 | 352.622 | 4.25328 | 6.24787 | 362.144 | 5.16766 | 6.19236 |
| 29 | 510.519 | 331.417 | 5.88883 | 495.784 | 327.366 | 6.12889 | 504.484 | 329.758 | 6.02088 |
| 30 | 464.242 | 323.533 | 0.290639 | 451.756 | 328.194 | 0.532686 | 459.432 | 325.326 | 0.37736 |
| ⋮ | ⋮ | ⋮ | ⋮ | ⋮ | ⋮ | ⋮ | ⋮ | ⋮ | ⋮ |
Basic information
We are going to extract the basic tracking information:
- Object's id
- Number of objects
- Number of images
- Number of images with at least one object detected
objects = Set(data.id)
print("Objects id: ", objects)
Objects id: Set([10, 5, 9, 8, 13, 4, 1, 0, 12, 7, 11, 2, 3, 6])
numObjects = length(objects)
print("Number of objects: ", numObjects)
Number of objects: 14
numImages = maximum(data.imageNumber) + 1 # Image index starting at 0
print("Number of images: ", numImages)
Number of images: 200
numDetected = length(Set(data.imageNumber))
print("Number of images with at least one object detected: ", numDetected)
Number of images with at least one object detected: 200
Basic plots
We are going to make basic plots using Plots, StatsPlots and the PyPlot (that require a valid matplotlib installation) modules. For more information about plotting see https://docs.juliaplots.org/latest/tutorial/.
objectsByImage = zeros(numImages)
for i in 1:numImages
    objectsByImage[i] = length(Set(data.id[data.imageNumber .== i-1]))
end
Plots.plot(1:numImages, objectsByImage; title="Number of detected objects by frame", xlabel="Frames", ylabel="Objects", label=false)

dataObject0 = data[data.id .== 0, :]
distance = sqrt.(diff(dataObject0.xBody).^2 + diff(dataObject0.yBody).^2)
framerate = 25
time = diff(dataObject0.imageNumber)/framerate
velocity = distance./time
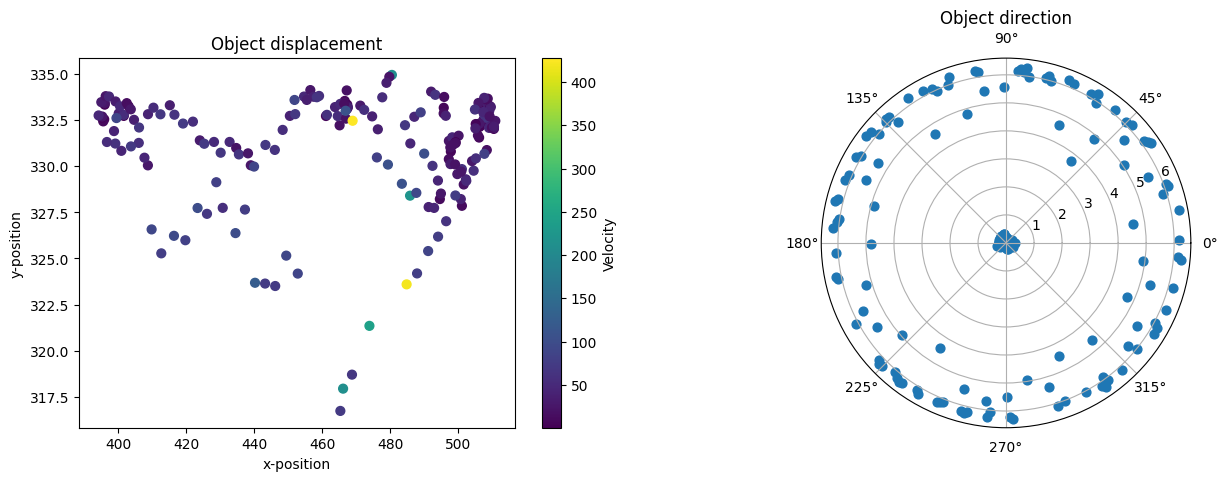
fig, ax = PyPlot.subplots(1, 2)
fig.subplots_adjust(right = 2)
ax[1] = PyPlot.subplot(121)
plot = ax[1].scatter(dataObject0.xBody[1:end-1], dataObject0.yBody[1:end-1], c=velocity, s=40)
ax[1].set_title("Object displacement")
ax[1].set_xlabel("x-position")
ax[1].set_ylabel("y-position")
bar = fig.colorbar(plot)
bar.set_label("Velocity")
ax[2] = PyPlot.subplot(122, projection="polar")
ax[2].scatter(1:length(dataObject0.tBody), dataObject0.tBody, s=40)
ax[2].set_title("Object direction")
PyObject Text(0.5, 1.0715488215488216, 'Object direction')
velocities = Any[]
for i in 1:numObjects
    distance = sqrt.(diff(data.xBody[data.id .== i-1]).^2 + diff(data.yBody[data.id .== i-1]).^2)
    time = diff(data.imageNumber[data.id .== i-1])/25
    velocity = distance./time
    append!(velocities, [velocity])
end
StatsPlots.boxplot(velocities, label=false, title="Velocity distributions", ylabel="Velocity (px/s)", xlabel="Objects")
